
Startups are focused on very rapid growth. Successful startups are experimental and data-driven, and their metrics are closely related to the metrics for measuring content success. Startups and digital content live in the same digital ecosystems.
This lecture introduces startup metrics from the perspective of a digital entrepreneur, investor, and consultant.
Relevance #
Startups are focused on very rapid growth. Successful startups are experimental and data-driven, and their metrics are closely related to the metrics for measuring the success of content. Startups and digital content live in the same digital ecosystems.
This lecture provides an introduction to startup metrics from the perspective of a digital entrepreneur, investor and consultant.
Measure the right things to support your business #
“If you cannot measure it, you cannot improve it”
If they don't speak about the Product Market Fit (PMF) your data say nothing
To define your organization’s success, you need to determine the metrics you will use. A metric gives meaning to measurement, and to find the right metrics, you need to know what supports your company best. There is no one-size-fits-all solution: Which metrics you choose depends on what business you support and, speaking of content, which business problem you want to solve via content. Many successful organizations have developed their particular metrics. Many of them are open and can be analyzed and compared via services like Baremetrics.
There are different main types of metrics. Often they are classified by the categories:
- Quality
- Quantity
- Efficiency
For start-ups, i.e., those companies that are just entering the market and thus generating real profit for the first time, there are a few “special” metrics. Of course, these indicators apply to start-ups, but they are best suited for this type of company.
- Customer Acquisition Cost (CAC, Patel 2021)
- Retention (Smith n.d.)
- Customer Churn Rate (Customer Churn Rate 2014)
- Customer Lifetime Value (LTV, Berger and Nasr 1998)
- Product Metabolism (Dolginow 2011)
- Viral coefficient (Chen 2008)
Companies that rely on metrics must ask themselves one important question in advance: When to apply which metrics? It is crucial to differentiate between the different metrics, like input and output metrics, to answer this question. Output metrics reflect the results, and input metrics indicate actions. Above all, before you start, you should base your decision on the data you get from your company.
What to achieve by Metrics? Product Market Fit (PMF) as a condition for Sustainable Growth #
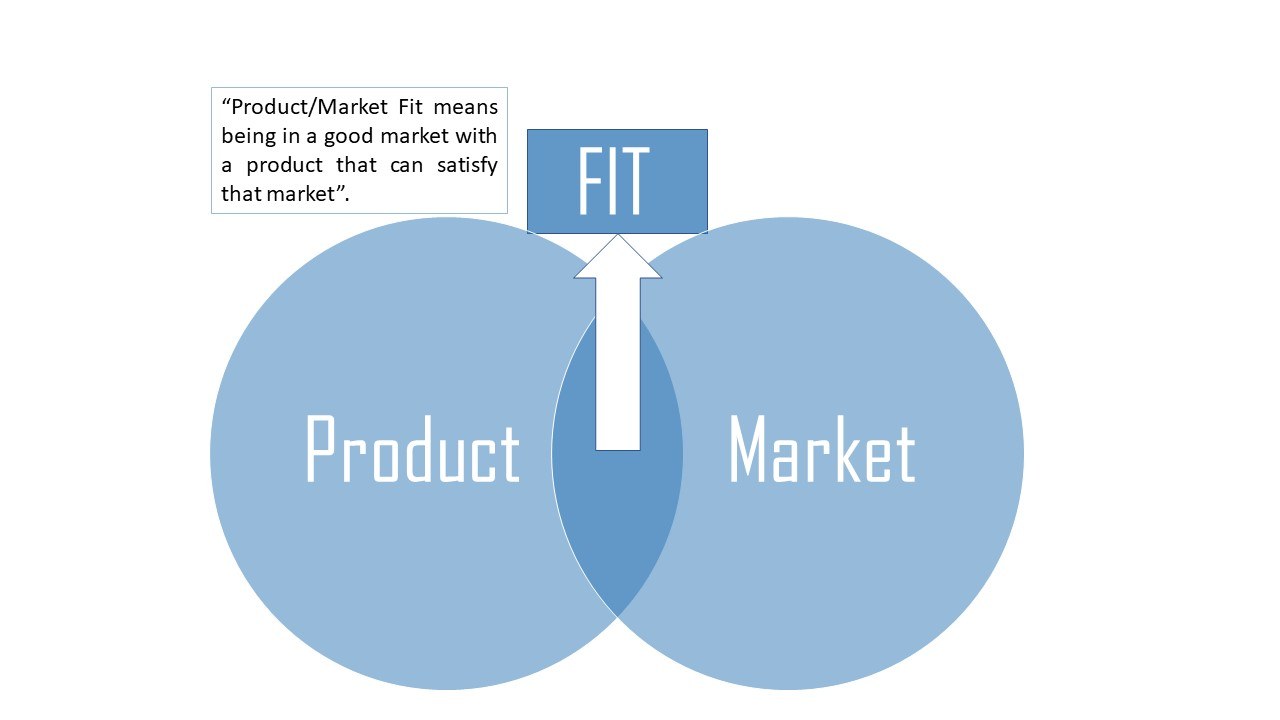
The Product Market Fit (PMF, Andreesen 2007) is not a metric, but it should guide a start-up’s analytics efforts as soon as product-specific information from the market can be gathered. The Product Market Fit is the degree to which a product satisfies strong market demand. Measuring the Product Market Fit is the first step for a company to gather feedback from the market and evaluate potential customers’ interest in specific products. The Product Market Fit can be considered one of the main orientation points of a start-up’s successful work.
Focusing on the PMF metric helps us:
- Respect fundamentals such as a sustainable business model
- Strive for long-term profitability (and not growth at all cost)
- Show how revenue ultimately surpasses costs (rather than making money straight away)
The cons of the PMF metric are manageable but still relevant:
- It is unclear what to track, when, and how
- Lack of focus on product-market fit
There is no magic formula for finding the perfect product/market fit. But there are some steps you can take to increase your company's success (Source: Bauer 2017).
- Target the right market: It is essential to have enough customers or users willing to spend money on your product. Your potential users should also grow, leading to growth in sales.
- Adapt and pivot when necessary: Until you achieve the product/market fit, it is essential to build on your product and develop your company (for example, your employees, culture, customers, etc.)
- Teamwork: Finding and achieving the product/market fit is a team effort. Everyone in your team should be involved in the process.
- Ask your targets: Research is vital in every step of the product life cycle but is most important when introducing a new product to a market. Ask your targets (not only your customers – think about all of your company's stakeholders) what they think about the product before you take their money. It is also an excellent way to establish a relationship with potential clients.
A North Star Metric (NSM) makes your data actionable
A data-based decision-making culture is the single most important competitive edge of startups against incumbents. But most startups are in love with their product and instead work on a “Product founder fit “ than a “Product market fit."
Find your personal North Star Metric (NSM) #

The AARRR funnel makes your data meaningful
Whatever you are doing – you need a metric that gives you an orientation for all of your business, often called a North Star Metric (van Gasteren 2021). It measures your overall company success and is essential to reach the maximum business growth potential. Just as the North Star is needed to align the entire coordinate system of the sky, the North Star metric provides a reference point for all other metrics, thus for all of an organization’s actions. Using the NSM Metric means finding the one metric that matters and best captures the product's core value. The metric also reflects your PMF. The North Star Metric will often be a combination of several metrics. Since it should measure the overall quality of your endeavor, it will be an output metric.
A North Star Metric is essential if a company (but also another organization or a campaign) wants to reach its maximum growth potential. To grow in the long-term, an organization will need to develop a long-term growth strategy, and for that, the ‘North Star Metric’ should be at the center of the growth strategy.
When defining your NSM, the company needs to know that “revenue” is the wrong choice. Revenue is what the customer pays in return for the product, whereas a north star metric is a value the product brings to people. To measure the sustainability of your project, a north star metric focuses on the matter the product creates. Additionally, having revenue as an NSM is misleading because it doesn’t have a clear long-term strategy.
There are numerous key reasons a company should have a North Star Metric. In other words, these are the pros of an NSM:
- Orientation: The NSM gives the company more exposure, including its core business and products.
- Core Value: The NSM captures the core value of the business and the company.
- Focus: The NSM provides a clear direction, and everyone has the same goal.
- Clarity: It is clear to everyone how and what the company is doing on a short- and long-term basis.
- Customer focus: The first concern is bringing value to the customer.
- Growth: Efficient long-term growth as the company is more focused on value.
The AARRR funnel – a proven combination of metrics #
The AARRR (Balke 2017) funnel deals with Acquisition, Activation, Retention, Referral and Revenue. It optimises the business journey and sets up some valuable and actionable metric goals for a company and especially for startups.
Acquisition metrics
The first A stands for the Acquisition metrics and shows where customers are coming from and whether there is enough space to grow. The CAC – Customer Acquisition Cost – shows the costs of convincing a potential customer to buy a product. This can be organic or paid. To explain this, here's an example: When you go into a shop in town and buy something, this purchase is an organic acquisition for the shop. However, if a flyer or other advertising has targeted you, it is a paid acquisition. A well-known acquisition metric is conversion rate (CR): the percentage of visitors who perform a specific desired action.
Activation Metrics
The next A stands for Activation and is related to the client’s first experience with the product. It depends on how customers feel about a product and the company behind it before consuming or using it. At this stage, metrics indicate the value of your product and how willing customers are to use and ultimately pay for it.
A well-known activation metric is CAC – Customer Acquisition Cost. CAC shows the costs of convincing a potential customer to buy a product. This can be organic or paid. The difference can be explained by an example: When you go into a shop in town and buy something, this purchase is an organic acquisition for the shop. However, if a flyer or other advertising has targeted you, then it is a paid acquisition.
Retention Metrics
Let’s move on to the R, which stands for Retention: It indicates the quality of growth. And that means how many customers who have bought from the company once come back and how often. Often a differentiation is made here between:
- DAU = Daily Active Users
- WAU = weekly active users
- MAU = monthly active users
In digital sales, these figures are particularly important. Various marketing campaigns try to push the numbers up and boost sales. This is precisely why you as a customer always receive advertising and newsletters from multiple companies. Good retention metrics inform the quality of growth, e.g., the percentage of daily users who become monthly users.
Referral Metrics
The second R stands for Referral Metrics and expresses the willingness of customers to recommend a product to their peers in figures. These metrics depend on definitions such as customer loyalty. Loyal customers who always buy from the same company, the same brand, and the same product are among the most critical assets for a company. Power users, brand lovers, and super followers are exceptionally loyal customers. Finding out which value is decisive for them is vital in estimating the Product Market Fit.
Revenue Metrics
Revenue Metrics show last but not least how to increase revenue and how the company can push up sales figures and profits respectively. An important metric in this section of the funnel ist the Customer Lifetime Value (CLTV). The CLTV shows the net profit from one customer over the whole span of time he or she is in a connection with a company. If you are one of the brand lovers or super followers of a company, then you will be treated accordingly and can enjoy some goodies. However, if you’re more like a casual shopper, then you’re not going to get the benefits. For this reason, loyal customers are always more important to companies than new customers. Finding new customers is easier than finding loyal ones - similar to friendships!
It optimizes the business journey and set up some valuable and actionable metric goals for a company and especially for start-ups. For long-term growth, a start-up needs to have an attribution model, a bidding model, to know where the customers are coming from, and which measures to take. The Attribution model means to know better which of your spending is doing great and which not. The retention metrics show a company where new growth is possible. In saturated markets, it is hard to get new customers and to increase sales. For that, it is important to know, where market growth is possible and where new customers can be fetched.
Not only for start-ups the AARRR is important. Also, long-existing companies should have a look at the five most important metrics, because those metrics effectively measure the company’s growth and are at the same time simple and actionable.
Where to go from here #
Startup metrics are a part of business analytics. The borders between business analytics and web / social media analytics are open. Many concepts and methods are used for both. Often, especially when content marketing is at stake, web and social media analytics is business analytics.
In our master’s program elements of this introductory lecture will be used in the courses on web and social media analytics and content marketing.
Presentation #
https://drive.google.com/file/...
Recommended Reading #
The Austrian company Speedinvest Pirates (disclosure: our lecturer Dieter Rappold ist on of its founders) offers a short and succinct guide to startup metrics for free: The ultimate guide to startup metrics (Weinmayr 2020)
Neil Patel, one of the most interesting and prolific authors in this field, gives an overview about some of the most important startup metrics in his blogpost 9 Metrics to Help You Make Wise Decisions about Your Start-Up (Patel 2011)
Find more literature regarding some of the mentioned topics in the references! We have tried to find one important post or paper for each of the mysterious acronyms in the text.
References #
Andreesen, Marc. 2007. “Product/Market Fit.” University Course. Stanford University: EE204 Business Management for Engineers and Computer. June 25, 2007. https://web.stanford.edu/class/ee204/ProductMarketFit.html.
Balke, Melanie. 2017. “AARRR Framework- Metrics That Let Your StartUp Sound Like A Pirate Ship.” Melanie Balke on Medium (blog). November 26, 2017. https://medium.com/@ms.mbalke/aarrr-framework-metrics-that-let-your-startup-sound-like-a-pirate-ship-e91d4082994b.
Bauer, Emily. 2017. “What Does It Take for a Startup to Achieve Product-Market Fit (PMF?).” November 15, 2017. https://www.propellercrm.com/blog/product-market-fit-pmf.
Berger, Paul D, and Nada I Nasr. 1998. “Customer Lifetime Value: Marketing Models and Applications.” JOURNAL OF INTERACTIVE MARKETING 12 (1): 14. https://doi.org/https://doi.org/10.1002/(SICI)1520-6653(199824)12:1<17::AID-DIR3>3.0.CO;2-K.
Chen, Andrew. 2008. “Viral Coefficient: What It Does and Does NOT Measure.” Personal Website. @andrewchen (blog). April 18, 2008. https://andrewchen.co/viral-coefficient-what-it-does-and-does-not-measure/.
“Customer Churn Rate: Definition, Measuring Churn and Increasing Revenue.” 2014. Retention Science (blog). October 30, 2014. https://www.retentionscience.com/blog/why-measuring-your-customer-churn-rate-increases-revenue/.
Dolginow, Dustin. 2011. “Why Product Metabolism Is Every Startup’s First KPI.” VentureFizz (blog). April 27, 2011. https://venturefizz.com/stories/boston/why-product-metabolism-every-startup-s-first-kpi.
Gasteren, Ward van. 2021. “What Is Your ‘North Star Metric’? + 8 Steps to Find Your NSM Immediately.” Grow with Ward (blog). February 4, 2021. https://growwithward.com/north-star-metric/.
Patel, Neil. 2011. “9 Metrics to Help You Make Wise Decisions About Your Start-Up.” Neil Patel (blog). October 19, 2011. https://neilpatel.com/blog/9-metrics/.
———. 2021. “Customer Acquisition Cost: The One Metric That Can Determine Your Company’s Fate.” Personal Website. Neil Patel (blog). March 2, 2021. http://neilpatel.com/blog/customer-acquisition-cost/.
Smith, Oren. n.d. “10 Customer Retention Metrics & How to Measure Them.” Company Website. Hubspot (blog). Accessed March 5, 2021. https://blog.hubspot.com/service/customer-retention-metrics.
Weinmayr, Julia, ed. 2020. The Ultimate Guide to Startup Metrics. Speedinvest Pirates. https://get.speedinvest-pirates.com/metrics-guide/.
Where to go from here #
Startup metrics are a part of business analytics. The borders between business analytics and web / social media analytics are open. Many concepts and methods are used for both. Often, especially when content marketing is at stake, web and social media analytics is business analytics.
Our master’s program elements of this introductory lecture will be
used in the courses on web and social media analytics and content
marketing.
The Austrian company Speedinvest Pirates (disclosure: our lecturer Dieter Rappold is one of its founders) offers a short and succinct guide to startup metrics for free: The ultimate guide to startup metrics (Weinmayr 2020)
Neil Patel, one of the most interesting and prolific authors in this field, gives an overview of some of the most critical startup metrics in his blogpost 9 Metrics to Help You Make Wise Decisions About Your Start-Up (Patel 2011)
Find more literature regarding some of the mentioned topics in the references! We have tried to find one important post or paper for each of the mysterious acronyms in the text.
References #
Andreesen, M. (2007, Juni 25). Product/Market Fit [University Course]. Stanford University: EE204 Business Management for Engineers and Computer. https://web.stanford.edu/class/ee204/ProductMarketFit.html
Balke, M. (2021, November 3). AARRR Framework- Metrics That Let Your StartUp Sound Like A Pirate Ship. Medium. https://medium.com/@ms.mbalke/aarrr-framework-metrics-that-let-your-startup-sound-like-a-pirate-ship-e91d4082994b
Bauer, E. (2017, November 15). What Does It Take for a Startup to Achieve Product-Market Fit (PMF?) | Propeller CRM Blog. Propeller. https://www.propellercrm.com/blog/product-market-fit-pmf
Berger, P. D., & Nasr, N. I. (1998). Customer lifetime value: Marketing models and applications. JOURNAL OF INTERACTIVE MARKETING, 12(1), 14. https://doi.org/https://doi.org/10.1002/(SICI)1520-6653(199824)12:1<17::AID-DIR3>3.0.CO;2-K
Chen, A. (2008, April 18). Viral coefficient: What it does and does NOT measure [Personal Website]. @andrewchen. https://andrewchen.co/viral-coefficient-what-it-does-and-does-not-measure/
Customer Churn Rate: Definition, Measuring Churn and Increasing Revenue. (2014, Oktober 30). Retention Science. https://www.retentionscience.com/blog/why-measuring-your-customer-churn-rate-increases-revenue/
Dolginow, D. (2011, April 27). Why Product Metabolism Is Every Startup’s First KPI. VentureFizz. https://venturefizz.com/stories/boston/why-product-metabolism-every-startup-s-first-kpi
Gasteren, van, W. (2021, February 4). What Is Your ‘North Star Metric’? + 8 Steps to Find Your NSM Immediately. Grow with Ward (blog). https://growwithward.com/north-star-metric/
Patel, N. (2011, October 19). 9 Metrics to Help You Make Wise Decisions About Your Start-Up. Neil Patel (blog). https://neilpatel.com/blog/9-metrics/
Patel, N. (2021, March 2). Customer Acquisition Cost: The One Metric That Can Determine Your Company’s Fate. Neil Patel (blog). http://neilpatel.com/blog/customer-acquisition-cost/
Smith, O. (o. J.). (2021, March 5). 10 Customer Retention Metrics & How to Measure Them. Hubspot (blog). https://blog.hubspot.com/service/customer-retention-metrics
Weinmayr, J. (ed.) (2020). The Ultimate Guide to Startup Metrics. Speedinvest Pirates. https://get.speedinvest-pirates.com/metrics-guide/
This article is a student-written report on the content of a part of the course Brand driven content strategy in the 1st semester of the M.A. program in content strategy.
It reflects the understanding of the content from the students' point of view and may therefore contain interpretations that do not coincide with the views of the instructor.